Business.com aims to help business owners make informed decisions to support and grow their companies. We research and recommend products and services suitable for various business types, investing thousands of hours each year in this process.
As a business, we need to generate revenue to sustain our content. We have financial relationships with some companies we cover, earning commissions when readers purchase from our partners or share information about their needs. These relationships do not dictate our advice and recommendations. Our editorial team independently evaluates and recommends products and services based on their research and expertise. Learn more about our process and partners here.
U.S. Cities With the Largest Gender Pay Gaps in 2026
Fremont, California, Frisco, Texas, and Cary, North Carolina have the largest gender pay gaps among full-time workers in the largest U.S. cities.
Business.com earns commissions from some listed providers. Editorial Guidelines.
Table of Contents
Key Findings
Women working full-time year-round jobs in the United States earn 17% less than men, based on an analysis of the American Community Survey.
In 97% of the largest U.S. cities (166 out of 170), women’s average hourly wages are lower than men’s.
Fremont, California, Frisco, Texas, and Cary, North Carolina have the most significant gender pay gaps among major U.S. cities, with full-time working women earning at least $35,000 less than men each year.
Women working full-time earn less than men in every U.S. state, with the widest gaps observed in Wyoming, Utah, Louisiana, Washington, and New Jersey.
Across 553 occupations, women working full-time earn less than men in nearly 90% of roles.
The most significant occupational pay gaps are found in financial securities and commodities sales, financial advising, mine engineering, and podiatry, with substantial disparities also appearing in medical professions, chief executive roles, and transportation occupations.
The gender pay gap remains one of the most persistent economic inequalities in America. It continues to shape outcomes for women in business, but its impact varies dramatically depending on where they live.
Using American Community Survey data, we examined gender pay gaps across 170 of the largest U.S. cities, all 50 states, and 553 occupations. Women working full-time today earn 17 percent less than men nationwide, but in some cities and professions, the pay gap exceeds 30 percent!
Let’s explore where this issue crops up the most, and why the gender pay gap still exists in 2026.
How this report defines the gender pay gap
Throughout this report, the gender pay gap is determined by the difference between women’s and men’s annual median wages among people who worked full-time jobs year-round.
What U.S. Cities Have the Largest Gender Pay Gap?
Typically, American women working full-time earn $55,678 annually, compared to $66,965 for men. This is a difference of $11,287. However, the difference between men’s and women’s wages varies widely across the country.
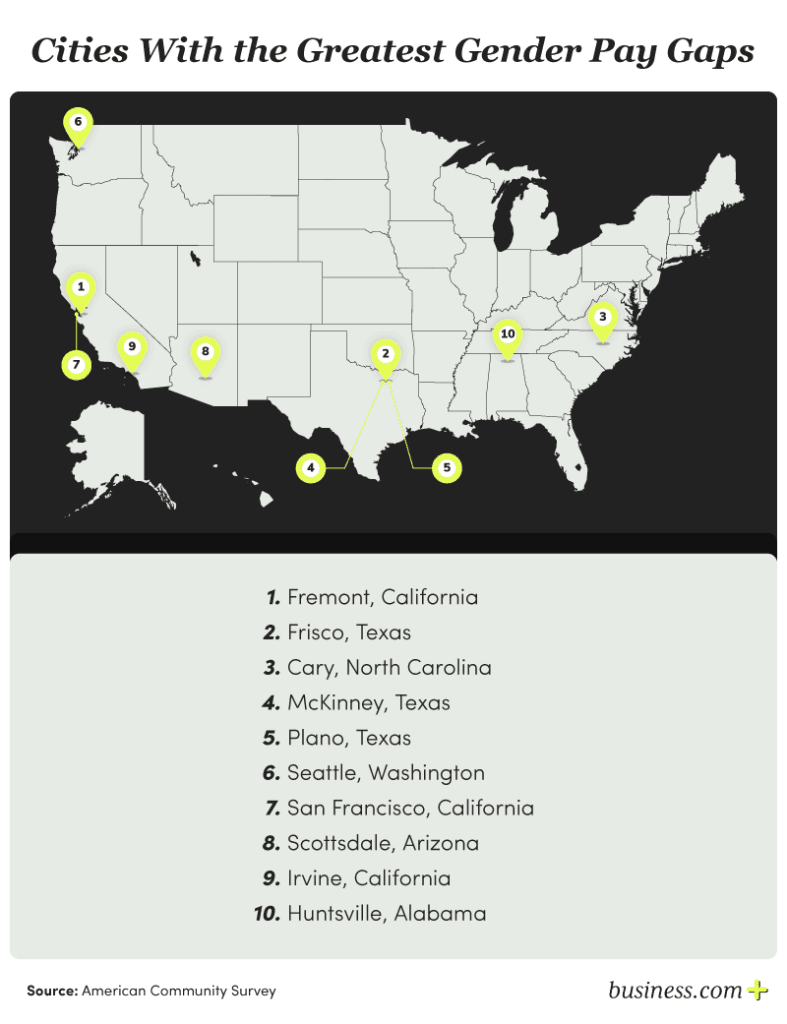
Fremont, California had the most significant gender pay gap among the 170 largest U.S. cities we analyzed. Women working full-time in Fremont earned $41,037 (or 33 percent) less each year than men.
U.S. Cities With the Largest Gender Pay Gaps
Difference between men’s and women’s median annual earnings, among full-time, year-round workers
City
Men’s median annual earnings
Women’s median annual earnings
Annual pay gap
Fremont, California
$141,777
$100,224
-$41,553
Frisco, Texas
$121,907
$80,870
-$41,037
Cary, North Carolina
$116,746
$81,029
-$35,717
McKinney, Texas
$101,316
$71,232
-$30,084
Plano, Texas
$100,195
$70,608
-$29,587
Seattle, Washington
$120,968
$91,844
-$29,124
San Francisco, California
$129,882
$101,925
-$27,957
Scottsdale, Arizona
$100,544
$75,823
-$24,721
Irvine, California
$118,254
$94,302
-$23,952
Huntsville, Alabama
$75,982
$52,048
-$23,934
Sunnyvale, California
$152,112
$128,227
-$23,885
Huntington Beach, California
$92,970
$72,333
-$20,637
Overland Park, Kansas
$88,498
$68,294
-$20,204
Chandler, Arizona
$86,463
$66,432
-$20,031
Henderson, Nevada
$76,734
$57,089
-$19,645
Baton Rouge, Louisiana
$61,352
$41,918
-$19,434
Rancho Cucamonga, California
$85,951
$67,017
-$18,934
Gilbert, Arizona
$89,544
$70,681
-$18,863
San Jose, California
$99,629
$81,110
-$18,519
Augusta-Richmond County, Georgia
$60,201
$42,355
-$17,846
Eugene, Oregon
$67,494
$50,495
-$16,999
Elk Grove, California
$87,025
$70,259
-$16,766
Virginia Beach, Virginia
$72,442
$56,036
-$16,406
Corpus Christi, Texas
$57,352
$41,397
-$15,955
Lakewood, Colorado
$80,524
$65,214
-$15,310
Shreveport, Louisiana
$56,671
$41,467
-$15,204
Fort Worth, Texas
$66,525
$51,534
-$14,991
Sioux Falls, South Dakota
$66,073
$51,261
-$14,812
Washington, District of Columbia
$111,603
$97,942
-$13,661
Newport News, Virginia
$59,107
$45,513
-$13,594
Madison, Wisconsin
$71,304
$57,722
-$13,582
Atlanta, Georgia
$92,311
$78,805
-$13,506
Pittsburgh, Pennsylvania
$70,598
$57,142
-$13,456
Colorado Springs, Colorado
$69,011
$55,833
-$13,178
Charlotte, North Carolina
$71,025
$58,039
-$12,986
New Orleans, Louisiana
$64,221
$51,379
-$12,842
Boise, Idaho
$71,785
$59,298
-$12,487
Pembroke Pines, Florida
$65,284
$52,970
-$12,314
Modesto, California
$66,103
$53,825
-$12,278
Brownsville, Texas
$49,338
$37,076
-$12,262
Austin, Texas
$81,479
$69,362
-$12,117
Vancouver, Washington
$69,803
$57,949
-$11,854
Raleigh, North Carolina
$71,054
$59,372
-$11,682
Palmdale, California
$56,968
$45,450
-$11,518
Fontana, California
$63,345
$51,858
-$11,487
Glendale, Arizona
$57,145
$45,889
-$11,256
Rochester, New York
$61,146
$50,159
-$10,987
Lancaster, California
$65,403
$54,462
-$10,941
Albuquerque, New Mexico
$62,421
$51,527
-$10,894
Fort Collins, Colorado
$72,877
$61,999
-$10,878
When examining pay gaps between full-time, year-round workers, we noticed an interesting geographic pattern: California leads with 16 cities in the top 50 (32 percent of the list), including Fremont in the number one spot on the list. The Bay Area cluster (San Francisco, Sunnyvale, San Jose) all appear in the top 20, demonstrating that even in progressive tech hubs, massive pay disparities persist for women who work as much as men.
Texas claims the second-highest concentration with nine cities, particularly in the Dallas suburbs, where Frisco (#2), McKinney (#4), and Plano (#5) show women earning $29,000-$41,000 less than men annually. Arizona suburbs around Phoenix—Scottsdale, Chandler, Gilbert, and Glendale—represent eight percent of the list.
Where Do Women Earn More Than Men?
Women’s median annual earnings are higher than men’s in just four out of the 170 cities we analyzed:
Glendale, California: women’s median earnings were $8,452 higher than men’s.
Oakland, California: women earn $4,500 more than men per year.
Yonkers, New York: women’s median earnings are $1,722 more than men’s median annual earnings.
Fayetteville, North Carolina: the median annual pay for women is just $388 higher than it is for men.
What States Have the Largest Gender Pay Gaps?
In every single state, women’s median earnings are less than men’s, but some states have broader gaps than others. For example, Wyoming women typically earn $19,076 less than men, a 32 percent difference. Utah women’s median annual earnings are $17,521 less than men’s, or a 29 percent gap.
States With the Largest Gender Pay Gaps
Difference between men’s and women’s median annual earnings, among full-time, year-round workers
State
Men’s median annual earnings
Women’s median annual earnings
Annual pay gap
Wyoming
$60,414
$41,338
-$19,076
Utah
$60,116
$42,595
-$17,521
Louisiana
$55,537
$39,564
-$15,973
Washington
$68,934
$54,241
-$14,693
New Jersey
$73,274
$58,687
-$14,587
New Hampshire
$65,577
$51,886
-$13,691
Alabama
$52,944
$39,279
-$13,665
Michigan
$58,217
$44,758
-$13,459
West Virginia
$51,384
$38,263
-$13,121
Indiana
$54,853
$41,870
-$12,983
Virginia
$64,763
$51,818
-$12,945
Connecticut
$71,854
$58,957
-$12,897
Illinois
$62,904
$50,078
-$12,826
Oklahoma
$51,568
$38,752
-$12,816
Massachusetts
$75,301
$62,628
-$12,673
Idaho
$52,095
$39,425
-$12,670
Pennsylvania
$59,694
$47,442
-$12,252
North Dakota
$57,019
$44,839
-$12,180
Ohio
$56,339
$44,230
-$12,109
Iowa
$55,526
$43,442
-$12,084
Montana
$52,541
$40,600
-$11,941
Kansas
$54,631
$42,859
-$11,772
Nebraska
$54,918
$43,245
-$11,673
South Dakota
$52,233
$40,618
-$11,615
South Carolina
$51,792
$40,204
-$11,588
Colorado
$63,343
$51,802
-$11,541
Wisconsin
$56,764
$45,231
-$11,533
Minnesota
$63,305
$51,915
-$11,390
Missouri
$53,655
$42,273
-$11,382
Rhode Island
$62,391
$51,069
-$11,322
Mississippi
$47,379
$36,128
-$11,251
Kentucky
$51,706
$40,506
-$11,200
Texas
$54,847
$43,927
-$10,920
Alaska
$64,397
$53,722
-$10,675
Oregon
$58,539
$47,931
-$10,608
Tennessee
$51,323
$40,951
-$10,372
Georgia
$53,634
$43,598
-$10,036
Hawaii
$58,013
$48,269
-$9,744
Maine
$54,283
$44,547
-$9,736
Maryland
$69,948
$60,599
-$9,349
Arkansas
$47,656
$38,518
-$9,138
Arizona
$53,352
$44,346
-$9,006
Delaware
$59,573
$50,670
-$8,903
North Carolina
$51,824
$42,973
-$8,851
California
$62,668
$53,866
-$8,802
New York
$64,403
$55,664
-$8,739
New Mexico
$49,190
$40,568
-$8,622
Florida
$49,411
$41,496
-$7,915
Nevada
$51,292
$43,487
-$7,805
Vermont
$54,858
$48,672
-$6,186
The top 10 worst states reveal an unexpected geographic mix: energy-dependent states (Wyoming, Louisiana, North Dakota, Oklahoma), high-cost coastal states (Washington, New Jersey, New Hampshire, Massachusetts, Connecticut), and traditional manufacturing regions (Alabama, Michigan, West Virginia, Indiana).
Surprisingly, some wealthier states show significant absolute gaps despite having strong pay equity policies. Washington (#4), New Jersey (#5), Massachusetts (#15), and Connecticut (#12) all rank among the 15 worst states. While these states may have smaller percentage gaps than other states, their high overall wage levels translate into large absolute dollar losses for women. A typical woman in Massachusetts working full-time year-round earns $62,628 annually—the highest median salary among all states—yet she’d still lose $12,673 compared to her male counterparts’ $75,301.
What Jobs Have the Worst Gender Pay Gaps?
In nearly 90 percent of the 553 occupations we analyzed, women’s median annual pay was less than men’s. Overall, women’s annual wages tended to be lower than men’s, but some jobs exhibit extreme pay discrepancies of up to 50 percent. We’ll explore a few of those fields below.
50 Occupations With the Largest Gender Pay Gaps
Difference between men’s and women’s median annual earnings, among full-time, year-round workers
Occupation
Men’s median annual earnings
Women’s median annual earnings
Annual pay gap
Securities, commodities, and financial services sales agents
$147,225
$77,270
-$69,955
Personal financial advisors
$150,679
$86,745
-$63,934
Mining and geological engineers, including mining safety engineers
$112,100
$52,196
-$59,904
Podiatrists
$198,142
$143,566
-$54,576
Model makers and patternmakers
$61,808
$12,380
-$49,428
Explosives workers, ordnance handling experts, and blasters
$71,522
$22,168
-$49,354
Other financial specialists
$109,978
$64,320
-$45,658
Brokerage clerks
$93,908
$50,696
-$43,212
Cardiovascular technologists and technicians
$95,134
$52,823
-$42,311
Financial managers
$124,972
$82,680
-$42,292
Diagnostic medical sonographers
$119,442
$77,415
-$42,027
Power plant operators, distributors, and dispatchers
$107,114
$65,127
-$41,987
Rail transportation workers
$81,125
$40,234
-$40,891
Chief executives
$191,756
$151,010
-$40,746
Financial clerks
$101,779
$62,461
-$39,318
Dentists
$203,068
$163,991
-$39,077
Electrical and electronics repairers, industrial and utility
$80,280
$41,553
-$38,727
Judges, magistrates, and other judicial workers
$149,966
$111,581
-$38,385
Millwrights
$81,451
$43,750
-$37,701
Desktop publishers
$93,414
$56,540
-$36,874
Financial examiners
$106,978
$70,511
-$36,467
Nurse anesthetists
$248,779
$212,481
-$36,298
Fish and game wardens
$71,813
$37,168
-$34,645
Models, demonstrators, and product promoters
$76,542
$42,241
-$34,301
Transportation inspectors
$80,579
$47,138
-$33,441
Lawyers
$181,226
$148,567
-$32,659
Ship and boat captains and operators
$86,440
$53,813
-$32,627
Locomotive engineers and operators
$103,322
$71,079
-$32,243
Excavating and loading machine and dragline operators, surface mining
$66,318
$34,302
-$32,016
Sales managers
$124,546
$92,967
-$31,579
Architects, except for landscape or naval
$121,655
$91,016
-$30,639
Judicial law clerks
$90,767
$60,456
-$30,311
Actuaries
$161,905
$131,654
-$30,251
Title examiners, abstractors, and searchers
$81,789
$51,855
-$29,934
Commercial and industrial designers
$100,433
$70,780
-$29,653
Miscellaneous plant and system operators
$83,212
$53,650
-$29,562
Database administrators and architects
$120,990
$92,384
-$28,606
Electrical power-line installers and repairers
$92,437
$65,224
-$27,213
Engine and other machine assemblers
$61,257
$34,443
-$26,814
Insurance sales agents
$81,053
$54,504
-$26,549
Petroleum engineers
$180,594
$154,352
-$26,242
Real estate brokers and sales agents
$93,824
$68,754
-$25,070
Aircraft pilots and flight engineers
$150,921
$126,238
-$24,683
Social science research assistants
$85,571
$61,024
-$24,547
Home appliance repairers
$51,180
$27,051
-$24,129
Sales and related workers, all other
$70,660
$46,615
-$24,045
Credit counselors and loan officers
$90,490
$66,459
-$24,031
Optometrists
$160,629
$136,822
-$23,807
Insurance underwriters
$97,986
$74,287
-$23,699
Other psychologists
$120,529
$96,936
-$23,593
Financial services
The largest occupational pay gaps exist in financial services, with full-time securities and commodities sales agents showing a staggering $69,955 annual gap, the worst in America. Personal financial advisors had the second-largest gap, at $63,934, and “other financial specialists” ranked seventh-worst, with women earning $45,658 less than men.
Financial managers, financial clerks, and financial examiners were among the 25 occupations with the most considerable pay disparities, demonstrating that gender pay gaps pervade every level of the finance industry—from entry-level clerks to senior managers.
Medical and healthcare
Despite requiring extensive education and training, medical occupations show substantial pay gaps. Female Podiatrists typically earn $54,576 less annually, cardiovascular technologists lose $42,311, and diagnostic medical sonographers face a $42,027 gap. Even full-time female nurse anesthetists, one of the highest-paid nursing specialties, earn about $36,298 less annually than men.
A 2023 study found that over a lifetime, female physicians earn $2 million less than male physicians over a simulated 40-year career, even after adjusting for specialty, practice type, and other factors. Significant gaps between dentists and optometrists in our analysis confirm this pattern persists across medical specialties.
Executive and professional roles
Women hold just 10 percent of chief executive positions in Fortune 500 companies, and when they do reach these roles, they may earn substantially less than their male counterparts even when working the same hours year-round. According to our analysis, female CEOs typically earn $40,746 less than male CEOs in the same role.
Female lawyers face a $32,659 gap, and judges and magistrates have a $38,385 disparity between men and women. These are highly credentialed professions where education and experience, in theory, should eliminate pay gaps, yet significant disparities persist.
Race, Ethnicity, and Age Compound Gender Wage Gaps
Research from the National Women’s Law Center confirms that while all women are susceptible to wage gaps, women of color tend to face even more significant disparities in their wages compared to men. The data we analyzed from the American Community Survey also clearly shows the pay inconsistencies between women of different ethnicities.
Compared to all American men:
Native American women earn 41 percent less per hour ($16)
Hispanic women earn 38 percent less per hour ($15)
Biracial women earn 32 percent less per hour ($13)
White women earn 18 percent less per hour ($7)
Japanese women earn two percent less per hour ($0.83)
Chinese women earn 12 percent more per hour ($5)
Women in different age groups also have varying degrees of pay differences with men. Younger women (ages 18-29) experience the widest hourly pay gap, earning $16.82 per hour less than all men. This translates to $39,005 less annually.
Pay Differences Between Women of Different Ages and All Men (U.S.)
Age group
Percent difference between women’s and men’s hourly wages
Difference in average hourly wage
Difference in average annual wage
18-29
-42.8%
-$16.82
-$39,004.75
30-44
-15.7%
-$6.18
-$12,498.04
45-59
-13.5%
-$5.31
-$9,178.98
60+
-8.5%
-$3.32
-$21,832.99
The gap narrows for women ages 30-44 and 45-59, then narrows further for women aged 60 or older. However, the annual pay gap for older women jumps dramatically to 31 percent, reflecting that older women are significantly more likely to work part-time or have interrupted work histories.
Methodology
This analysis examines gender-based pay differences in the United States using microdata from the U.S. Census Bureau’s 2024 American Community Survey (ACS). All results are weighted using the ACS’s official person weights to ensure findings are nationally representative of the U.S. workforce.
The analysis focuses on full-time, year-round workers, defined by the Census as individuals who worked at least 35 hours per week and at least 50 weeks in the past year. The study includes only employed individuals, excluding those not participating in the labor force, to ensure that all comparisons reflect active workers across both early- and late-career stages.
Gender pay gaps were calculated using median annual earnings, based on respondents’ reported wage and salary income from the prior 12 months, as defined by the ACS. Pay gaps are expressed as the dollar difference between men’s and women’s median earnings, as well as the percentage difference, where applicable.
In addition to national-level findings, the analysis evaluates gender pay gaps across all 50 U.S. states and the 170 most populous U.S. cities, based on the latest available Census population estimates. The report also examines median gender pay differences across 553 occupations and professional categories using ACS demographic variables. City, state, and occupational rankings are based on median earnings for full-time, year-round workers.
The report also examines how gender pay gaps vary by race, ethnicity, age group, and veteran status. These demographic comparisons include both direct comparisons between men and women within the same group and comparisons of women in specific demographic groups to all men overall. These pay gap estimates are based on average hourly earnings among all employed workers and may differ from city, state, and occupational rankings, which focus on median annual earnings for full-time, year-round workers.
All data reflect the most recent finalized ACS estimates available at the time of analysis.
The report also analyzes wage differences across 553 occupations, major industry sectors, U.S. states, and the 170 most populous metropolitan areas, using 2023 Census metropolitan definitions. Geographic comparisons reflect aggregate wage differences between all employed women and all employed men within each location.
Chad Brooks is the author of "How to Start a Home-Based App Development Business," drawing from over a decade of experience to mentor aspiring entrepreneurs in launching, scaling, and sustaining profitable ventures. With a focused dedication to entrepreneurship, he shares his passion for equipping small business owners with effective communication tools, such as unified communications systems, video conferencing solutions and conference call services.
As business.com's managing editor, over the years Brooks has covered everything from CRM adoption to HRIS usage to evolving trends like pay transparency, deepfakes, co-working and gig working.
A graduate of Indiana University with a degree in journalism, Brooks has become a respected figure in the business landscape. His insightful contributions have been featured in publications like Huffington Post, CNBC, Fox Business, and Laptop Mag. Continuously staying abreast of evolving trends, Brooks collaborates closely with B2B firms, offering strategic counsel to navigate the dynamic terrain of modern business technology in an increasingly digital era.