This article is sponsored by Intuit.
When you first set up your accounting software, the system hands you a chart of accounts before you’ve entered a single transaction. It is built from your industry and entity type, it looks official, and most owners never touch it again. That is a mistake, and it is usually the reason your reports don’t answer the questions you actually have.
Your chart of accounts determines what your financial statements can tell you. Get it right and your profit and loss statement shows you which parts of the business are working. Get it wrong and you end up staring at a “General Expenses” line that swallows a third of your spending and explains none of it. Here’s how to build one that earns its keep.
What is a chart of accounts?
A chart of accounts (COA) is the master index of every account your business uses to record transactions. Every dollar that moves through your business lands in one of them, and every report you run comes from those accounts, just sorted and totaled.
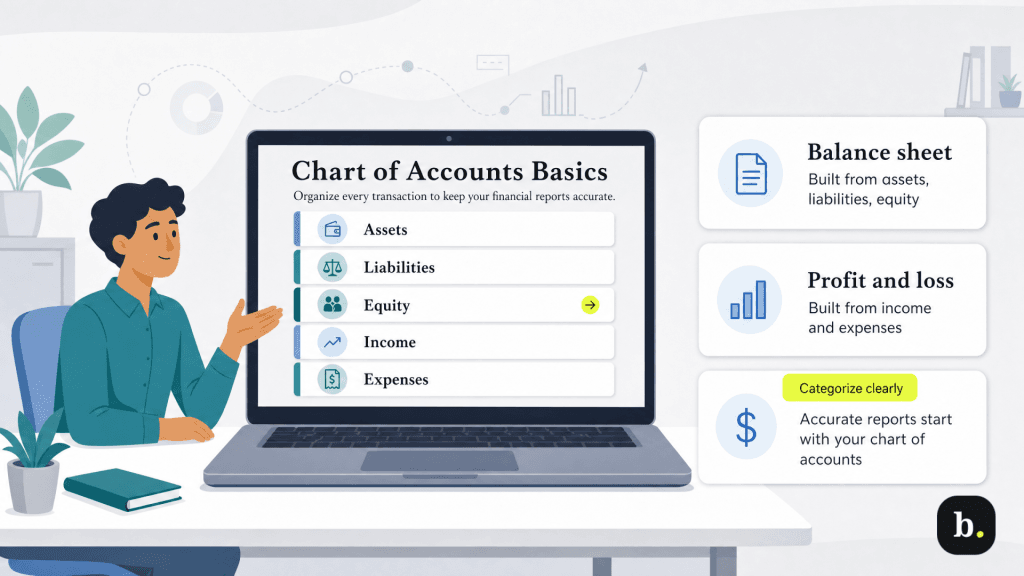
Accounts fall into five types:
- Assets: What you own, including cash, accounts receivable, equipment and inventory.
- Liabilities: What you owe, including accounts payable, credit cards and loans.
- Equity: What’s left for the owners after liabilities are subtracted from assets.
- Income: What you earn from doing business.
- Expenses: What it costs you to earn it.
The first three build your balance sheet. The last two build your profit and loss statement. These reports are why setting up your COA properly matters. Categorizing your transactions appropriately is what makes your reports accurate; failing to do so means you’re acting on a distorted picture of your business’s fiscal health.
Why the default list usually isn’t enough
Default charts are built for the average business in your industry. The list you’re handed is a reasonable starting point, but may not be suitable for your unique circumstances. There are two important reasons you should consider reconfiguring this default COA.
First, it is too generic where you need detail. A default chart gives a landscaping company one “Sales” account. But if that company does weekly maintenance, one-off installs and snow removal, a single revenue line hides which of those three is actually carrying the business.
Second, it is too detailed where you don’t need it. Default charts tend to include accounts for situations you’ll never encounter, and every unused account is one more thing to scroll past and one more chance to miscategorize.
A "General Expenses" or "Miscellaneous" line that grows into one of your largest expense categories is the clearest sign your chart needs work. It means transactions are being filed there because nothing better exists. An oversized catch-all line also draws unwanted attention on a tax return, since the IRS provides a specific
Schedule C line for most common business expenses and expects "other expenses" to be the exception.
How to structure your accounts
Before you decide which accounts to create, decide how they’ll be organized. Two conventions do most of the work.
Account numbering
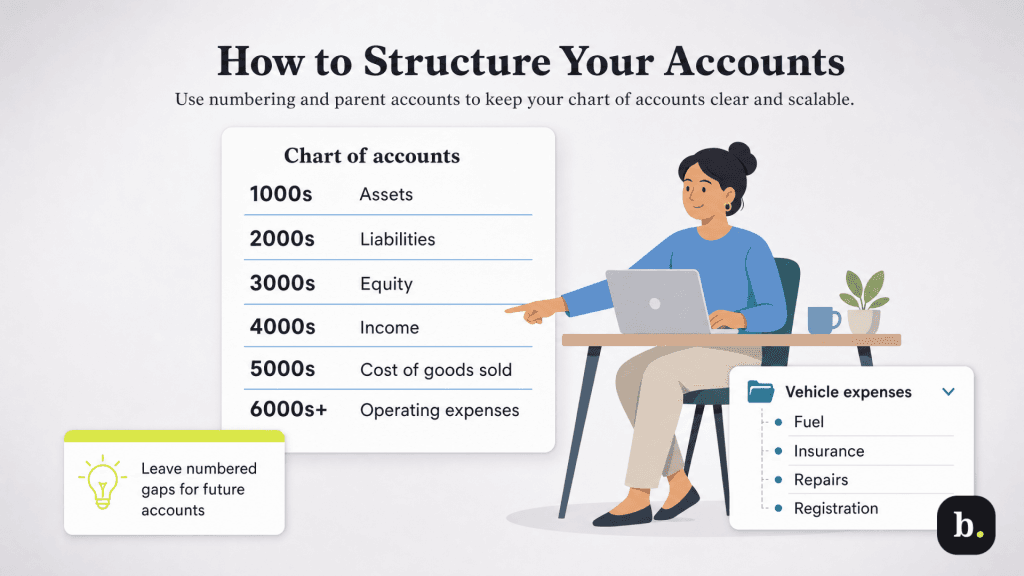
Numbering groups accounts by type and controls the order they appear in reports. The widely used convention assigns a range to each type:
- 1000s: Assets
- 2000s: Liabilities
- 3000s: Equity
- 4000s: Income
- 5000s: Cost of goods sold
- 6000s and up: Operating expenses
The specific numbers don’t matter, but consistency does. Numbering is optional in most accounting software and usually switched off by default, but once you have more than a couple dozen accounts, it is the difference between a list you can navigate and one you scroll through hunting for the account you know is in there somewhere.
Leave gaps. If your first three income accounts are 4000, 4010 and 4020, you can add a fourth revenue stream at 4015 next year and it will sort where it belongs. Number them 4001, 4002 and 4003 and your only options are to append new accounts at the end or renumber the whole section.
Parent accounts and sub-accounts
Sub-accounts nest under a parent account, letting you track detail without cluttering the top level of your reports. A “Vehicle Expenses” parent might hold sub-accounts for fuel, insurance, repairs and registration. On a summary report, you see one vehicle number. Expand it and you see where the money went. This is useful for providing the option for granular detail without cluttering reports unnecessarily.
How to build your COA, step by step
Entrepreneurs often begin with the default account list and prune it. However, we suggest starting with your reports instead.
1. Write down the questions you want answered
List the questions you’re most likely to ask of your reports. Which service line is most profitable? Is labor or materials driving my costs up? What am I spending on software? Those questions are your account list — you’re just writing them in a different notation.
2. Map your revenue streams
Create one income account per meaningful revenue stream, where “meaningful” means you would make a different decision if you knew it was up or down. A consultant with retainer clients and one-off projects needs two accounts, not one. A restaurant with dine-in, takeout and catering needs three.
3. Separate COGS from operating expenses
Cost of goods sold covers costs that scale with sales, like materials, direct labor and merchant fees. Operating expenses are what you’d pay whether or not you sold anything, including rent, insurance and software. Blur the two and you cannot calculate gross margin, which is the number that tells you whether your pricing works.
4. Match tax line items where you can
Your accountant has to map your accounts to tax form lines eventually. If your expense accounts already line up with the categories on your return, that work is mostly done before it starts. Most accounting platforms handle this behind the scenes. QuickBooks Online, for example, assigns each account to an account type and a detail type, and those selections determine which report the data lands on and how it maps for tax purposes. Choosing them deliberately at setup is a small task that saves a real cleanup later.
5. Add sub-accounts only where you’d act on the detail
The test is simple: if you saw this number broken out, would you do anything differently? If yes, make it a sub-account. If not, leave it consolidated. “Office Supplies” split into “Paper,” “Pens” and “Toner” is a detail nobody has ever acted on.
QuickBooks Online allows up to five sub-accounts under a single parent, which is a useful constraint. If you’re bumping against it, that’s a signal the detail belongs in a report filter rather than in the chart itself.
Common mistakes to avoid
Most broken charts of accounts fail in one of five predictable ways.
- Creating too many accounts. An account per vendor or per project is a report filter’s job, not the chart’s. Charts bloated this way become unusable within a year.
- Renaming instead of merging. When you have duplicate accounts, renaming one doesn’t consolidate the history, it just gives you two similar accounts with a confusing paper trail.
- Mixing personal and business transactions. No chart of accounts survives this. It corrupts every report and every deduction downstream.
- Making an account for a one-time transaction. You bought a used van once. That doesn’t need a permanent account; it just needs to go somewhere sensible and be forgotten.
- Never revisiting it. The chart you set up for a two-person operation will not serve a twelve-person one.
Maintaining your COA as you grow
Review your chart once a year, and pick a moment when you’re already looking at your books. Right after your accountant finishes your return is ideal, because the friction points are still fresh.
Three questions do the job.
- Which accounts had no activity all year?
- Which had so much activity that you can’t tell what’s in them?
- Which questions did you ask this year that your reports couldn’t answer?
The first list gets deactivated, the second gets sub-accounts, the third gets new accounts.
When you’re consolidating duplicates, merging is the right move rather than deleting. This is because merging moves the historical transactions into the surviving account, so your prior-year reports stay intact. Be deliberate about it, though: in QuickBooks Online, merging is permanent and can’t be undone, and the accounts have to match on name, account type and detail type before the platform will combine them.
If you need to restructure mid-year, do it at the start of a quarter. Your year-over-year comparisons will have a seam in them regardless, but a seam on a clean quarter boundary is far easier to explain than one in the middle of March.
Set up your COA at the start for clean financials
A chart of accounts is not paperwork. It is the set of questions you’ve decided your business should be able to answer, written in the only language your financial reports understand. Spend an afternoon on it now and you get reports that tell you something for years. Skip it and you get a tidy-looking file that quietly tells you nothing. Start with the questions. The accounts follow.