Business.com aims to help business owners make informed decisions to support and grow their companies. We research and recommend products and services suitable for various business types, investing thousands of hours each year in this process.
As a business, we need to generate revenue to sustain our content. We have financial relationships with some companies we cover, earning commissions when readers purchase from our partners or share information about their needs. These relationships do not dictate our advice and recommendations. Our editorial team independently evaluates and recommends products and services based on their research and expertise. Learn more about our process and partners here.
The emergence of AI search adds new channels where your brand can be mentioned. Here’s how to track how often and in what contexts you’re showing up.


An AI answer can name your business, recommend a competitor or repeat outdated information about your services. Checking your company name once gives you a snapshot of one response. To understand how your brand appears over time, you need a consistent set of customer questions and a way to record the answers.
You can begin with manual checks and a spreadsheet, then add software when the workload warrants it. The goal is to learn where your business appears, whether the information is accurate and which findings deserve action. Here’s how to build a monitoring process that produces useful evidence for your marketing decisions.
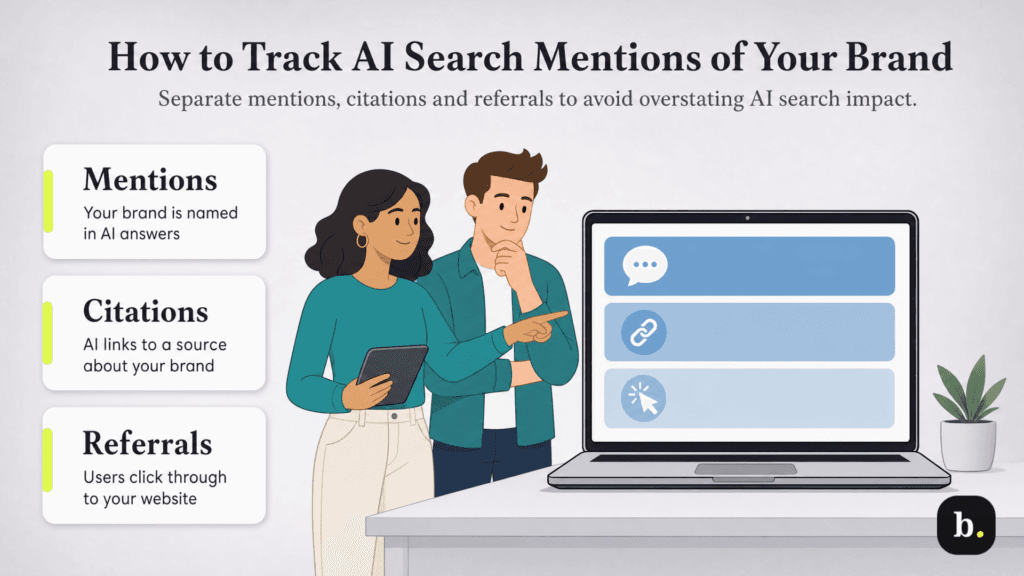
AI search monitoring involves asking relevant questions across selected platforms, recording how your business appears and repeating the process under comparable conditions. Examples of platforms to examine include ChatGPT’s search features, Google’s AI Overviews and AI Mode, Microsoft Copilot and Perplexity.
Keep three outcomes distinct from the beginning: a mention names your business, a citation points to a source and a referral brings someone to your website. A business can receive one without the others. The following steps help you track those differences without overstating what your sample reveals.
List your company name, product names and common variations. Note any similarly named businesses that could cause confusion. Choose a consistent competitor group based on the businesses customers actually consider alongside yours.
Next, collect questions from sales calls, support requests, customer interviews and website inquiries. Separate branded questions, which explicitly name a business, from unbranded questions that ask for information or recommendations without naming your brand.
For a hypothetical IT support company, the list might include:
Start with 15 to 25 prompts if that is a manageable workload for your team. This is a planning suggestion, rather than an industry benchmark. Label each prompt by topic and buying stage so broad educational questions do not obscure the results of provider-selection questions.
Prioritize platforms your customers use or that your business has a clear reason to investigate. If you lack that information, ask recent prospects how they researched providers and begin with a small selection. Expand after you understand the workload.
Record where each check happens, including the platform, interface, search mode, language and relevant location settings. Note the model when it is visible. Google’s AI Mode and an AI Overview accompanying a conventional search are different experiences, so label them separately.
Use fresh conversations and comparable settings where possible. Record whether personalization or saved context is enabled. These precautions improve consistency, although they do not eliminate differences between your checks and other users’ experiences.
Use one row for each prompt execution on each platform. Give prompts stable identifiers so you can preserve their history if you later add new questions. Save the complete response or a screenshot alongside the row when practical.
Capture the following information:
Define a usable answer before calculating rates. A completed AI answer without your company is a valid observation with no brand mention. A timeout is a failed check. A Google search that does not trigger an AI Overview belongs in a separate “no AI answer” category, rather than being silently counted as an answer that omitted your business.
Choose a schedule your team can maintain. A small business could run the same core prompt set biweekly, with additional checks for urgent accuracy issues. Larger teams may need more frequent observations or automated collection.
For example, 20 prompts checked on two platforms twice during a reporting period produce 80 planned executions. Record how many returned usable answers and how many failed or produced no AI answer. Use the same plan in the next period when possible.
Keep exploratory questions separate from the core set. Adding many easy branded questions can increase an aggregate mention rate without improving discovery among new customers. If you change prompts, competitors or collection methods, document the change and avoid presenting the resulting scores as directly comparable.
Repeated answers help you observe variability. They do not automatically create a representative sample of customer searches, and similar outputs from the same system should not be treated as independent proof of market-wide behavior.
A useful report can start with a handful of measures. Write down the counting rules so different employees classify answers consistently. For a simple manual method, count a brand once per answer even if it appears several times.
Use the following definitions as a starting point for your own log. Commercial tools may calculate similarly named metrics differently.
Metric | Suggested calculation | What to watch |
|---|---|---|
Mention rate | Usable answers naming your brand ÷ all usable answers × 100. | Separate branded and unbranded prompts. |
Website citation rate | Usable answers linking to your website ÷ all usable answers × 100. | Third-party coverage naming you is a different source category. |
Recommendation rate | Usable answers presenting your brand as a suitable option ÷ all usable answers × 100. | Define what counts as a recommendation before scoring. |
Competitive share of mentions | Your brand-answer count ÷ total brand-answer counts for the selected competitor group, including you, × 100. | Count each brand once per answer and keep the group stable. |
Factual accuracy | Checkable claims verified as accurate ÷ all reviewed checkable claims × 100. | Record incorrect, ambiguous and unverifiable claims separately. |
Suppose all 80 planned executions in a hypothetical reporting period return usable answers. If 24 name your company, the mention rate is 30 percent. If eight link to your website, the website citation rate is 10 percent. Neither figure tells you what percentage of all AI users encountered your brand.
Competitive share uses a different denominator. If your company appears in 24 answers, one competitor in 36 and another in 40, your share is 24 out of 100 brand-answer counts, or 24 percent. An answer can include several businesses, so this total is not necessarily the number of answers reviewed.
Report results by platform and prompt category before combining them. Keep sentiment separate from accuracy: an enthusiastic answer can still contain a wrong price, service area or product claim.
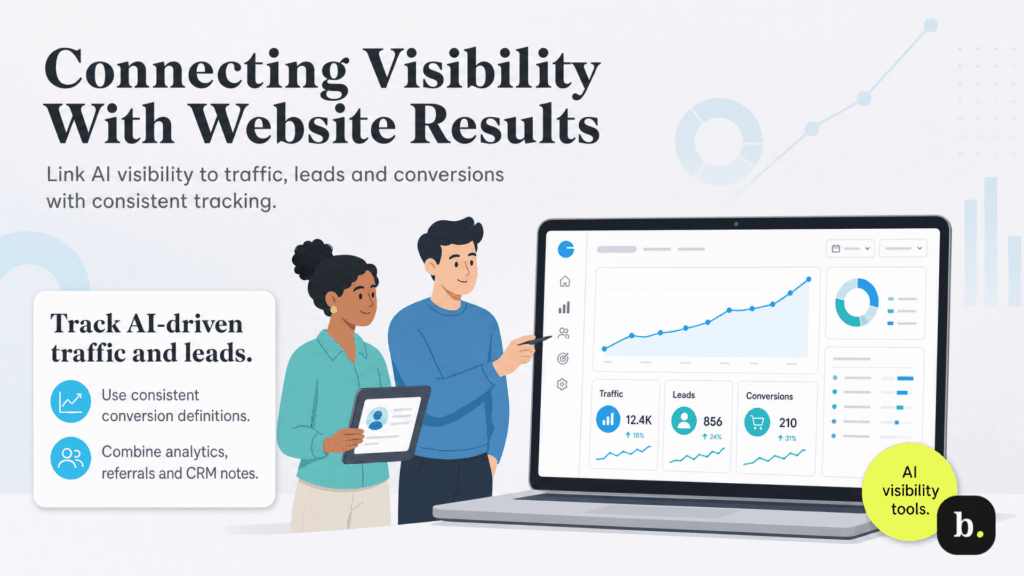
Use Google Analytics to examine identifiable traffic from AI platforms. Review source information, landing pages and meaningful conversions, such as qualified inquiries or completed purchases. Keep the conversion definition consistent across reporting periods.
Referral data answers a different question from your prompt log. Someone may read an answer without clicking, return later through another channel or encounter a mention on a third-party website. Those interactions may not be identifiable as AI referrals in your analytics.
Supplement digital attribution with a customer question such as, “How did you first hear about us?” Record useful details in your customer relationship management (CRM) system. Treat that information as additional context, since customer recollections and website attribution each have limitations.
Turn observations into specific tasks. If important buying questions repeatedly omit your company, review whether your website clearly explains the relevant offering. If answers repeat outdated hours, investigate your own pages and cited business profiles. If referrals arrive but fail to convert, review the landing page and next step.
Save the evidence, assign an owner and set a follow-up date. Maintain a change log so future reports can distinguish new content, corrected information and changes in monitoring methods.
When inaccurate portrayals also appear in reviews, listings or news coverage, coordinate the response with your online reputation management work. For a broader action plan, see our guide to improving AI visibility.
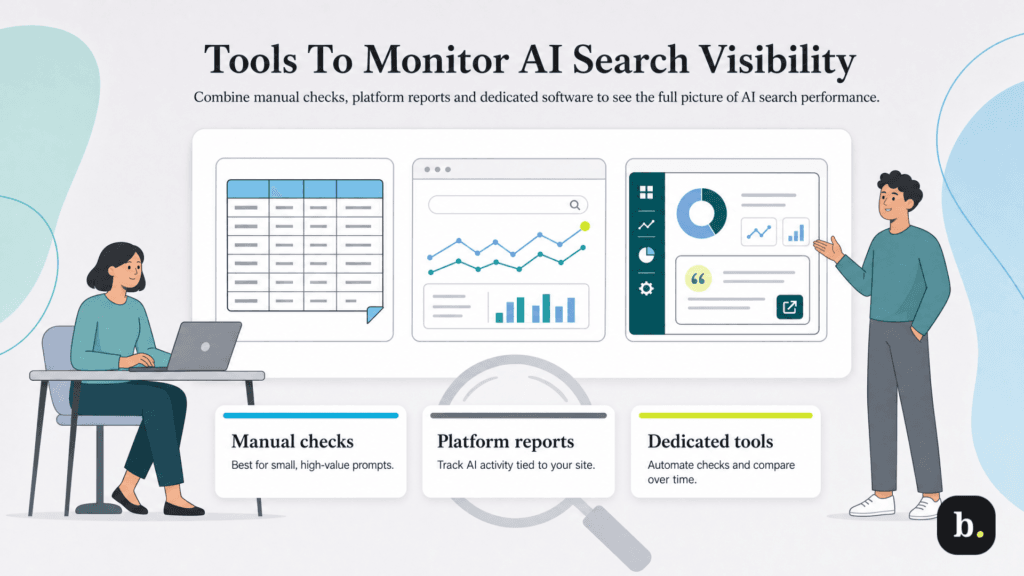
Your monitoring method should fit the decisions you need to make and the time your team can spend. Manual checks, platform reporting and dedicated software provide different kinds of evidence. Combining them can be more useful than expecting one dashboard to explain everything.
Begin by defining the scope you need: platforms, prompts, markets, competitors and reporting frequency. Use that scope to compare AI visibility platforms and identify which capabilities justify paying for a tool.
A spreadsheet makes the method visible and lets you examine context closely. It works well for learning what to record, checking factual claims and investigating a small set of commercially important questions.
The limitation is workload. Every added platform, market and repetition increases the number of answers someone must collect and review. Set a realistic limit, retain source evidence and spot-check classifications if several people share the task.
Google provides a Generative AI performance report in Search Console for supported Search features, including AI Overviews and AI Mode. It reports impressions for links to your site, with dimensions such as page, country, date and device. Google says a report may be unavailable when a site lacks sufficient impressions.
Bing provides an AI Performance dashboard covering citation activity across Microsoft Copilot, AI-generated Bing summaries and selected partner integrations. It includes total citations, page-level citation activity and sampled grounding queries, which are retrieval phrases rather than a complete record of users’ prompts.
These reports show activity connected to your website within their supported experiences. They do not constitute a complete count of every brand mention. Website analytics adds evidence about identifiable visits and conversions, while your prompt log preserves the context of sampled answers.
Dedicated software can repeat prompt checks, preserve historical results and organize comparisons. Two examples illustrate how these tools can support the workflow:
Before subscribing, ask how each service collects responses and what its metrics include. Check whether it uses consumer interfaces, application programming interfaces (APIs) or another method. Confirm supported engines, locations, languages, collection frequency, retained answer evidence, exports and plan limits.
Also ask whether you can keep the same prompts over time and review the answers behind a score. A dashboard becomes more useful when you can investigate a change and connect it to a specific question or source.
A precise-looking percentage can hide an inconsistent method. Review your process whenever a report shows a large jump or decline. The first question should be whether the underlying observations are comparable.
Watch for these common mistakes:
If an outside provider manages tracking, ask for the prompt inventory, methodology and underlying evidence. Our guide to hiring an AI SEO agency explains how to assess the work behind an optimization proposal.
Build the report around decisions the team can make. Begin with the monitored scope: dates, prompts, platforms, markets, usable answers and collection failures. Identify changes in scope before presenting performance trends.
Then summarize five things:
For example, “We appeared in 24 of 80 sampled answers, with most omissions in local provider questions” gives the team a specific result to investigate. “Our AI visibility is 30 percent” leaves the scope unclear.
Keep your core monitoring set stable and use additional questions to explore new opportunities. As the history grows, focus on recurring findings that lead to concrete improvements in how customers discover and understand your business.
