Business.com aims to help business owners make informed decisions to support and grow their companies. We research and recommend products and services suitable for various business types, investing thousands of hours each year in this process.
As a business, we need to generate revenue to sustain our content. We have financial relationships with some companies we cover, earning commissions when readers purchase from our partners or share information about their needs. These relationships do not dictate our advice and recommendations. Our editorial team independently evaluates and recommends products and services based on their research and expertise. Learn more about our process and partners here.
These KPI tools turn complex business data into dashboards your team can actually use.


Small business owners often struggle to track their companies’ key performance indicators (KPIs) because of packed schedules and limited time to dig into reports or learn new tools. But businesses that consistently track KPIs tend to make faster, better-informed decisions, and that often leads to more profitable growth over time.
We’ll break down 14 excellent KPI tools for businesses of all sizes, compare key features and pricing, and explain what to look for as your reporting needs grow.
KPI tools (often called KPI dashboard tools or KPI dashboard software) are digital platforms that automatically collect, organize and visualize key performance indicators from your business systems, helping teams track progress toward their goals in real time. Most KPI tools present that data through dashboards, charts and alerts that make it easier to spot trends, measure performance and catch problems early.
Understanding how your business is performing — whether you’re measuring employee productivity, financial results or quarterly goals — helps explain why your company is (or isn’t) hitting its targets. That means managers need to carve out time to review the metrics that matter most to their operations.
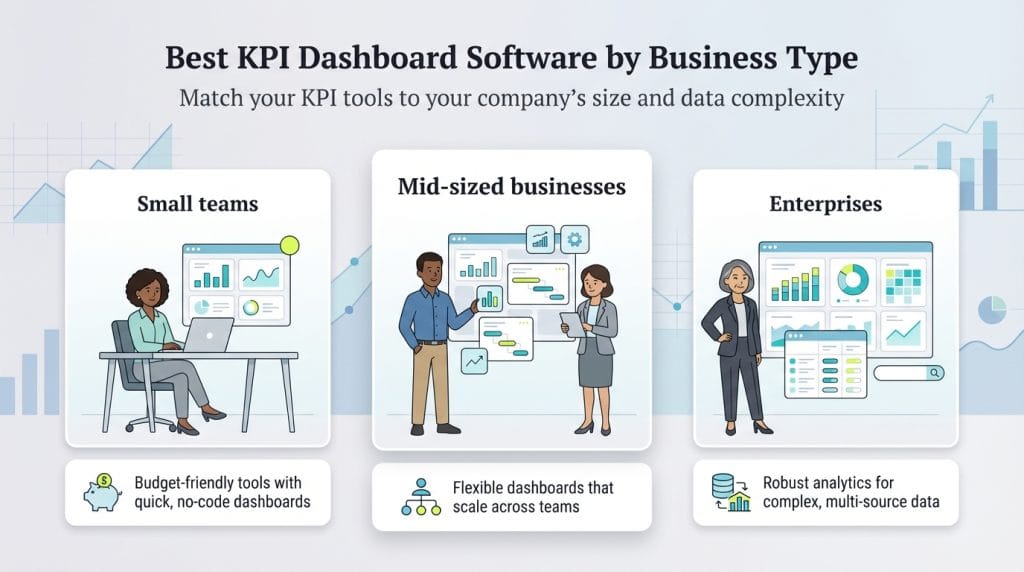
To make your search easier, we’ve organized these 14 KPI dashboard tools by business type, from startups and small teams to growing agencies and large enterprises. Whether you need a simple, no-code dashboard or advanced business intelligence (BI) software, these platforms can help you track the metrics that matter most.
For startups and small teams with limited budgets but growing data needs, these tools offer the best value:
Our comprehensive review of HubSpot CRM explains how the platform’s omnichannel communication tools help businesses connect with customers across multiple touchpoints to improve engagement, personalization and customer retention.
Mid-sized businesses and agencies need tools that balance advanced features with scalability:
Asana is also considered one of the best goal-setting and tracking apps for businesses. Its goals feature helps teams set objectives, track progress, add subgoals and monitor individual and team contributions.
Large enterprises require robust platforms that can handle complex data requirements and multiple user roles:
To help you compare your options at a glance, we’ve highlighted each platform’s pricing, integrations and collaboration features. Use this chart to narrow down which KPI dashboard tools best fit your team, budget and business goals.
Tool | Pricing | Key integrations | Collaboration features |
|---|---|---|---|
Databox | Free tier available; paid plans start at $159/month | 130+ sources, Google Analytics, HubSpot, Salesforce | Real-time alerts, automated reports, team sharing |
Datapad | Plans start at $15/month | 50+ sources, SQL, BigQuery, Google Ads, Facebook Ads | Chat-based AI assistant, unlimited users on Pro plan |
Data Studio | Free (Data Studio Pro available at $9/user/project/month) | Google Analytics, Google Ads, Google Sheets, BigQuery | Real-time collaboration, sharing via links |
SimpleKPI | Plans start at $15/month | Zapier, Google Sheets, Excel | User roles, sharing, embedding |
HubSpot | Free account available; advanced features require paid products | 2,000+ apps, Smart CRM, Google Workspace, Zoom | Teams, custom reporting, workflow integrations |
Scoro | Plans start at $19.90/user/month | QuickBooks, Xero, Google Calendar, Dropbox | Project collaboration, unlimited widgets |
Klipfolio | Plans start at $120/month | 100s of pre-built connectors, SQL databases, REST API | Dashboard sharing, scheduled email reports |
Geckoboard | Plans start at $119/month | 90+ integrations including Google Analytics, Salesforce, Shopify | TV dashboards, shared links, automated snapshots |
Grow | Contact for pricing | 150+ integrations, SQL databases, HubSpot, Salesforce | Unlimited users, shared dashboards |
Asana | Free Personal plan; paid plans start at $10.99/user/month | Google Workspace, Jira Cloud, Dropbox, Salesforce | Card system, team assignments |
ThoughtSpot | Free trial available; plans start at $25/user/month | BigQuery, Salesforce, Google Sheets | Search-driven collaboration, Liveboards |
Tableau | Plans start at $15/user/month | Salesforce, Excel, multiple data sources | Team collaboration, advanced analytics |
Power BI | Free plan available; Pro starts at $14/user/month | Microsoft 365, Azure, various connectors | Teams integration, automated reports |
Salesforce | Free plan available for up to two users; paid plans start at $25/user/month | AppExchange apps, native integrations, third-party add-ons | Shared dashboards, pipeline visibility, team collaboration |
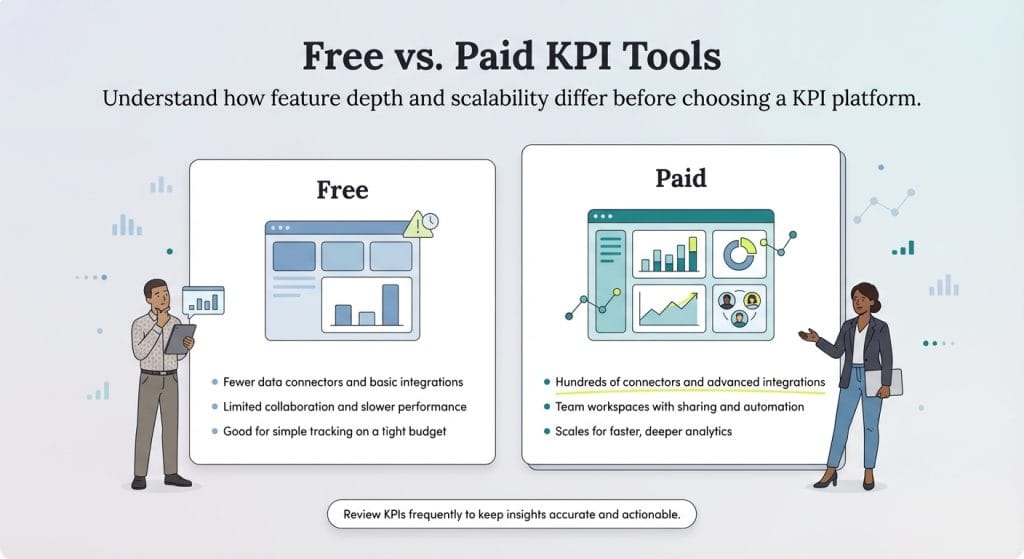
Free KPI tools can be a smart starting point for solo operators, startups and small teams that need basic reporting without a major upfront investment. Paid platforms often offer deeper integrations, stronger collaboration features and more room to scale as reporting needs grow.
Free platforms like Data Studio and Databox make it easy to build dashboards, connect core data sources and track performance without committing to a subscription. They work well for businesses with simple reporting needs or limited budgets.
However, free tools may come with limitations such as:
Paid KPI software is designed for growing businesses that need more flexibility, automation and cross-team visibility, though those added capabilities typically come with higher monthly costs.
Common advantages of paid platforms include:
For many growing businesses, the added cost is often offset by time saved on reporting, faster access to insights and better-informed decisions.
Even the best KPIs won’t help much if no one’s reviewing them regularly. Ongoing analysis can help you catch small issues before they become bigger problems, but those insights are only as useful as your data integrity and your team’s ability to act on what the numbers are telling you.
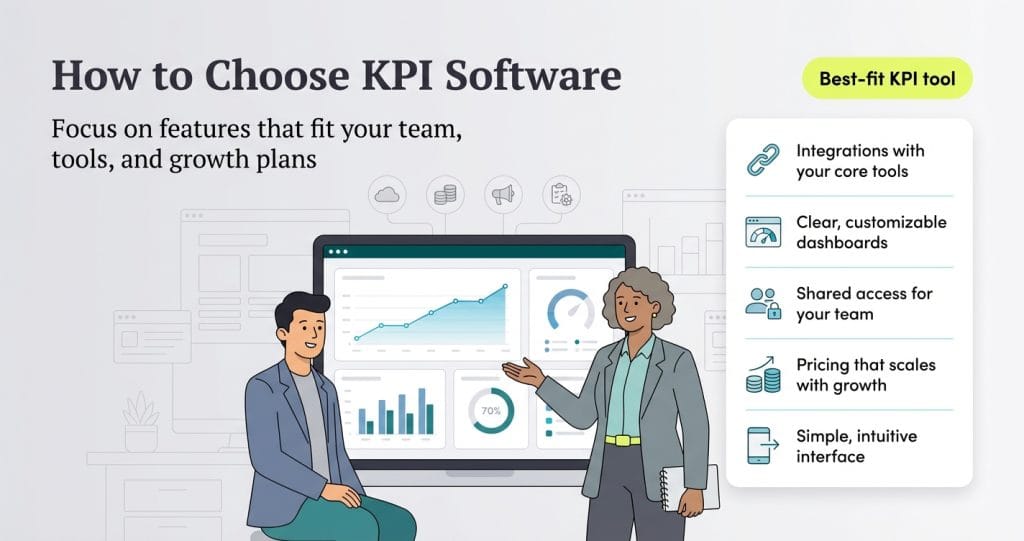
Choosing KPI software is easier when you start with your reporting needs instead of the flashiest dashboard. Before you compare plans, think about which metrics actually matter, who on your team needs access and what tools the platform needs to connect with.
Here are a few reasons why setting and tracking KPIs is essential for business growth.
KPIs give you a clear way to measure performance against your business goals, spot what’s working and catch issues before they turn into bigger problems.
“KPIs provide valuable insights that help inform decisions, allowing businesses to make more informed choices about how best to achieve their desired outcomes,” explained Tomas Keenan, founder of Step It Up Academy.
Without clearly defined KPIs, it’s much harder to measure progress, spot gaps early or know whether your business is moving in the right direction.
A KPI dashboard brings your most important metrics into one place, making it easier to catch problems early and see where new opportunities may be emerging. For example, if sales start to slow, tracking metrics such as calls made, appointments kept or trade events attended can help you pinpoint what’s changed and adjust your strategy before a small dip becomes a bigger issue.
“Alternatively, suppose you have a fantastic concept for a new product,” said Brad Anderson, founder and CTO of Fruition. “Before launching it on a large scale, you may test it with a few clients and use KPIs to validate your business model. You may track the number of interested customers, the cost to support the new product, the net promoter score, the implementation time, the number of defects, etc.”
KPIs can give you a quick snapshot of how your business is performing, from employee productivity and customer satisfaction to operational efficiency and revenue. Rather than tracking dozens of metrics, focus on the numbers that reveal whether your business is moving in the right direction.
“I have discovered that it is essential to measure a few metrics for each of the four categories: employees, customers, processes and revenue,” said Sean Stevens, founder and CEO of Immerse Education. “These are disciplines associated with human resources, customer satisfaction, business processes and business strategy. First, ensure that you select the appropriate KPIs for your business; then determine who will be held accountable for them.”
Clearly defined KPIs give employees measurable goals and a better understanding of how their individual performance contributes to broader business objectives. When people know what success looks like — and how it’s being measured — it’s often easier to stay focused, take ownership and spot areas for improvement.
“When employees are given clear, measurable goals to work toward, they can take ownership of their work and feel a sense of accountability for their performance,” said Ryan Faber, founder and CEO of AppGen.
Databox, Data Studio and SimpleKPI stand out as some of the most user-friendly KPI tools for small businesses and growing teams. Databox offers drag-and-drop dashboard creation with pre-built templates, making it accessible for non-technical users. Data Studio provides a familiar Google-based interface that many business users can navigate intuitively. SimpleKPI features a clean design with AI-powered KPI generation that suggests relevant metrics based on your business description.
Yes, several platforms offer free KPI dashboards. Data Studio is completely free and includes unlimited dashboards and reports, with native integrations for Google tools like Google Analytics, Google Ads and Google Sheets, along with access to partner connectors. Databox also offers a free plan, with paid tiers that unlock additional data sources, historical reporting and more advanced features. Many paid platforms also offer free trials, giving businesses a chance to test dashboards, integrations and reporting tools before committing.
Yes, most modern KPI tools integrate with popular CRM platforms, spreadsheet software and other business applications. Common integrations include Salesforce, HubSpot and Pipedrive for CRM data, along with Google Sheets, Excel and CSV files for spreadsheet-based reporting. These connections can automatically pull data into your dashboards, reducing manual entry and helping teams work from more current, consistent information.
KPI tools are designed to help businesses track, visualize and act on specific performance metrics, while business intelligence platforms support broader reporting, data analysis and trend discovery across larger datasets.
KPI tools typically focus on dashboards, goal tracking and pre-built performance metrics, while BI platforms like Tableau and Microsoft Power BI often offer deeper analytics, more complex data modeling and greater customization.
For many small and midsize businesses, dedicated KPI tools offer a practical balance of functionality, ease of use and faster implementation.
Lauren Kubiak contributed to this article. Source interviews were conducted for a previous version of this article.