Business.com aims to help business owners make informed decisions to support and grow their companies. We research and recommend products and services suitable for various business types, investing thousands of hours each year in this process.
As a business, we need to generate revenue to sustain our content. We have financial relationships with some companies we cover, earning commissions when readers purchase from our partners or share information about their needs. These relationships do not dictate our advice and recommendations. Our editorial team independently evaluates and recommends products and services based on their research and expertise. Learn more about our process and partners here.
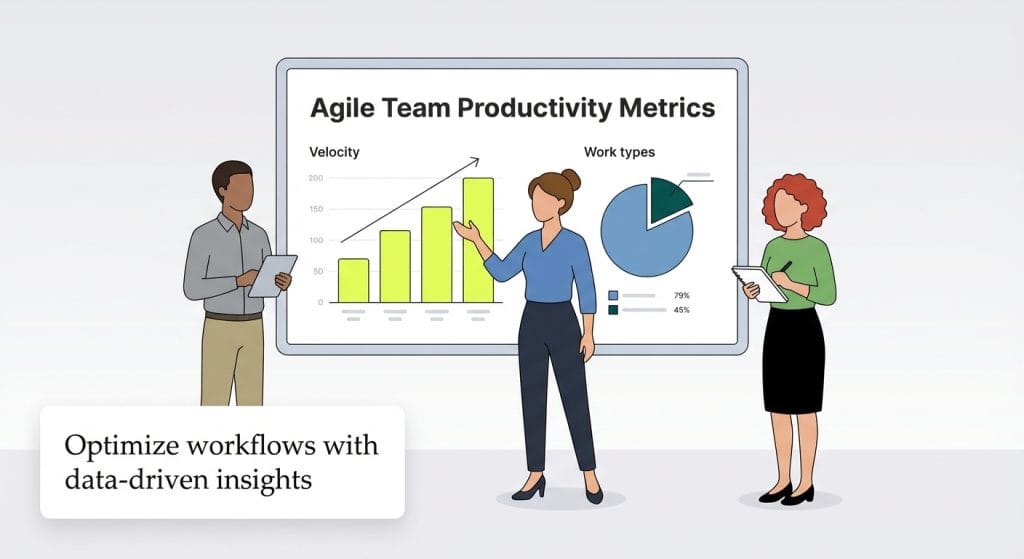
Agile team metrics let you extract the right skills in time for the right projects.
Agile methodology, a process that breaks down larger projects into smaller phases and focuses on constant improvement, is one of the more collaborative methods of project management. As such, efficiently measuring your team’s productivity is essential. Being able to measure how productive individuals are in each sprint of the project is helpful for employees, managers, and the process of effectively completing the overall project.
Metrics for measuring your agile team’s productivity help employees remain focused, offer a clear understanding of expectations, and allow your workers to complete jobs efficiently without stress impacting productivity.
At its core, agile methodology is an approach to project management that breaks down projects into smaller phases (often referred to as “sprints”) and is focused on continuous improvement.
“If your tasks are discrete enough to be measured and well specified enough to have accurate story points (an estimation that indicates the amount of effort to complete a task), you’ll have a predictive data point on the individual productivity of team members, the speed of the team as a whole, and a rough idea of how complete parts of your project are,” said Taylor Capito, founder and CEO of GenRait.
Be sure to pay attention to whether the tasks are completed in ways that reflect your story points, Capito said. “If they’re not, it means you’re under-specifying,” she said, which may suggest that the tasks aren’t suitable for the agile methodology.
Below are the four main pillars of the agile methodology.
In terms of methodologies, there is a variety of agile framework variations.
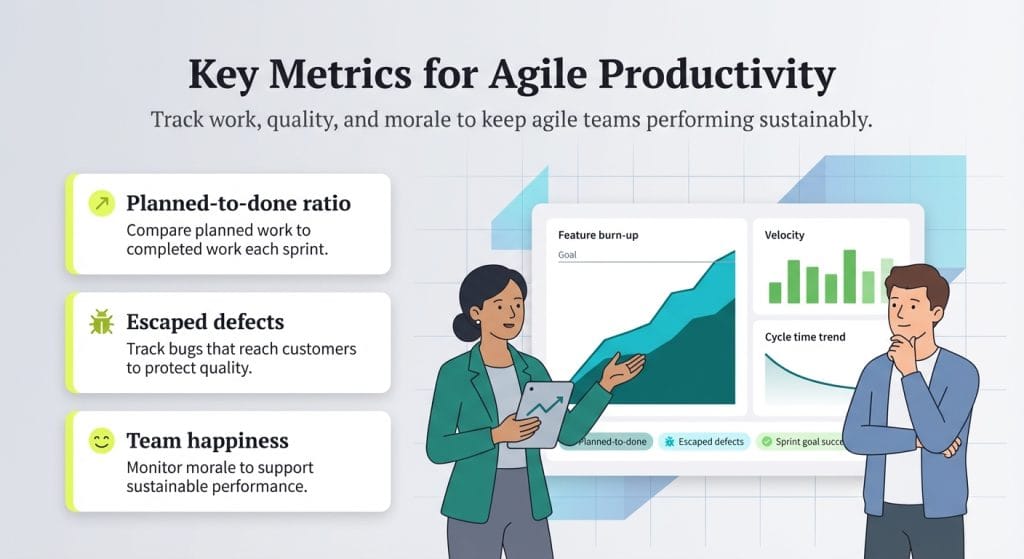
Understanding your employees using agile metrics allows you to create the best teams by matching the right skill sets to each project. Here are the top metrics for measuring your team’s agile productivity.
This ratio compares the percentage of tasks delivered as per specific guidelines. Customer-centricity emphasizes building the right product at the right time for the right market, but knowing how much your teams were able to accomplish against the list of planned tasks gets you accurate insights into both your current resources and their capabilities. Moreover, it gives you an overview of the complexities of the project, casting a shadow over tasks in terms of time, scope, and budgeting constraints, thus helping you identify the ones that overran their original estimates.
A bonus to this ratio is that you can instantly know if your talent-management processes need closer inspection. You can then update your skills inventory after identifying if your staff is using irrelevant bodies of knowledge or working with outdated skills. Once you acquire the appropriate hands before a project commences, you’ll avoid overworking existing staff who are inadequately prepared for the onslaught. What’s more, you’ll take the right skills off the bench and deploy them directly onto the right projects, ensuring that your teams are optimally utilized.
If your goal is to find and fix bugs before your customers do in the release environment, the escaped defects curve lets you contain 90 percent of the bugs in preproduction.
The first step to measuring defects is to consolidate all faults identified. Once you have an accurate count of the bugs, you’ll categorize the extent of risk. For that to happen, your team members should follow protocols to report problem areas as early as possible so they can be escalated via appropriate channels. Your teams will then spend less time finding and fixing errors when production is in full swing. They can minimize the chances of errors changing the longevity of the finished product and how it would look or function.
A low escaped defects ratio lets you establish a direct link between their efficiency and successful customer satisfaction. If 9 out of 10 tasks that fulfill client expectations are delivered on time, for example, your success rate is 90 percent.
User stories document how many points were gathered during the requirements analysis stage. This is when client briefs are represented digitally to begin task prioritization and sequencing. Teams get clarification on their work packages. The measure itemizes the number of stories committed to during the sprint planning and assesses how many of them are marked as completed.
Your staff can then divide their focus on different aspects of the same user story and work on it in parallel rather than in sequential blocks. If you’re building a flight ticketing system, for example, the development team can create user stories capturing bookings, cancellations, refunds, date changes, and points-based mileage. Each member can estimate their efforts by profiling the project on the aspects that are easy to recreate by simply rewriting code where applicable. This move ensures a closer match between the user stories that were committed and what gets done.
Acceleration is the simplest metric, using data relevance to monitor project health continuously. Measuring team velocity via velocity charts lets you know how different-sized teams are faring in individual sprints.
The first step to accelerating your team’s velocity is to create points that estimate the work in each iteration. Measuring team performances is akin to comparing snowflakes; no two are alike, because points are conceived based on their line of work. New velocities can be estimated from the initial velocities. A team of developers would measure the time taken to use a new skill, for example, while the operations team would factor in the time taken to learn the skill in the form of appropriate training programs.
To calculate the velocity, estimates of all features have to be added up along with user stories and product backlog items, which can be drawn back to the requirements gathered.
Acceleration Formula: (new velocity – initial velocity) / initial velocity
Given the ease of the calculation, you can plan future iterations by adjusting velocities by team size. Lastly, you can monetize performances to estimate business cost savings through process improvement. If you’re spending $50,000 per iteration and your acceleration is 5 percent, for example, you save $2,500 per iteration.
The golden rule of agility is to have your teams work on tasks that fit into iterative sprints. With each iteration lasting no longer than two weeks, your teams can downsize their work packages to fit into that window, regardless of how large a component being worked on is. That gives them optimal work to perform without cramming in tasks that are intrinsically complex and time-consuming.
Having shorter cycles within individual sprints ensures that everyone on the team is aware of short- and long-term targets. Subsequently, there’s no lapse in productivity down the chain. With deadlines approaching sooner, a shorter cycle time lets your team get more work done.
“[Cycle time] is crucial, because it helps identify how quickly the team can deliver increments of value,” said Alexandre Walsh, head of product at Axify. “Reducing cycle time allows the team to respond more promptly to customer needs and changing requirements, aligning with agile’s principle of frequent, incremental delivery.”
Monitoring trends in cycle time, as well as throughput velocity, can reveal sudden changes and gradual variations in team productivity. “Observing these trends enables teams to proactively identify potential challenges or areas for improvement, ensuring that they maintain a steady and predictable flow of work,” Walsh said. “Trend analysis is essential to understanding if the team’s efficiency is improving and helps pinpoint areas where adjustments can yield better performance.”
One of the most powerful tools for maintaining high performance in agile settings and fostering a culture of continuous improvement is sprint goal success rate, said Cache Merrill, an agile consultant and founder of Zibtek.
“This [metric] monitors if the team meets the goals that were set for each sprint cycle. It assesses how well the team is committed to delivering value over a set period,” Merrill said. “If the success ratios remain constant over time, then there are correct assumptions over the amount of work and priority set for tasks needed to be done in an agile environment to achieve predictability and for stakeholders to have trust.”
One of the most meaningful and actionable productivity key performance indicators (KPIs) is team happiness, said David Talbot, product director at WeWard.
Talbot explained that team happiness provides an important feedback loop on how well a team is succeeding at improving their processes. It also provides teams with the opportunity to better allocate their on-hand resources.
“Retrospective feedback assessing team morale and satisfaction is … critical because happy teams tend to be more productive and motivated,” Talbot said. “This is important to have a handle on at most stages of the process to ensure that all team members are aligned and motivated and that we are all rowing in the same direction.”
A key reporting metric for stakeholders and employees in management positions is the feature burn-up chart. Why? Because the chart shows the number of features delivered in each sprint, explained Alan Zucker, founding principal of Project Management Essentials and an instructor at the University of Georgia.
“Reporting features delivered is a tangible measure of progress,” Zucker said. “Stakeholders can easily correlate that to increased functionality. They often do not — and do not need to — understand the nuance of story points.”
Zucker said the feature burn-up chart can even be enhanced by adding the total number of requested features, because it provides an easy-to-understand view of progress on the overall project goal.
The interview-to-hire ratio is another big metric, because it helps identify where the gaps could lie within the process, said Amy Sharp, manager of client engagement and talent acquisition at TYR Talent Solutions.
“If the interview-to-hire ratio is low, we need to evaluate the internal decision-makers to see what we can do to help coach the interviewers,” Sharp said. “For example, if candidates in the process are taking too long for a response or next steps, or if the candidate falls off during the interview process due to a poor interview, this could impact so much more than one bad experience.”
Sharp also noted that there are several key factors when gauging your team’s productivity, but KPIs, like the interview-to-hire ratio, should be set based on individual roles. “This is the strongest way to accurately measure and provide clean data to take back to the leadership teams internally or externally to help constantly improve the recruitment funnel and process,” she said.
Danielle Fallon-O’Leary and Aakash Gupta contributed to the reporting and writing in this article.


